Story of an LTHEChat in Pictures
By Dr Chris P. Jobling

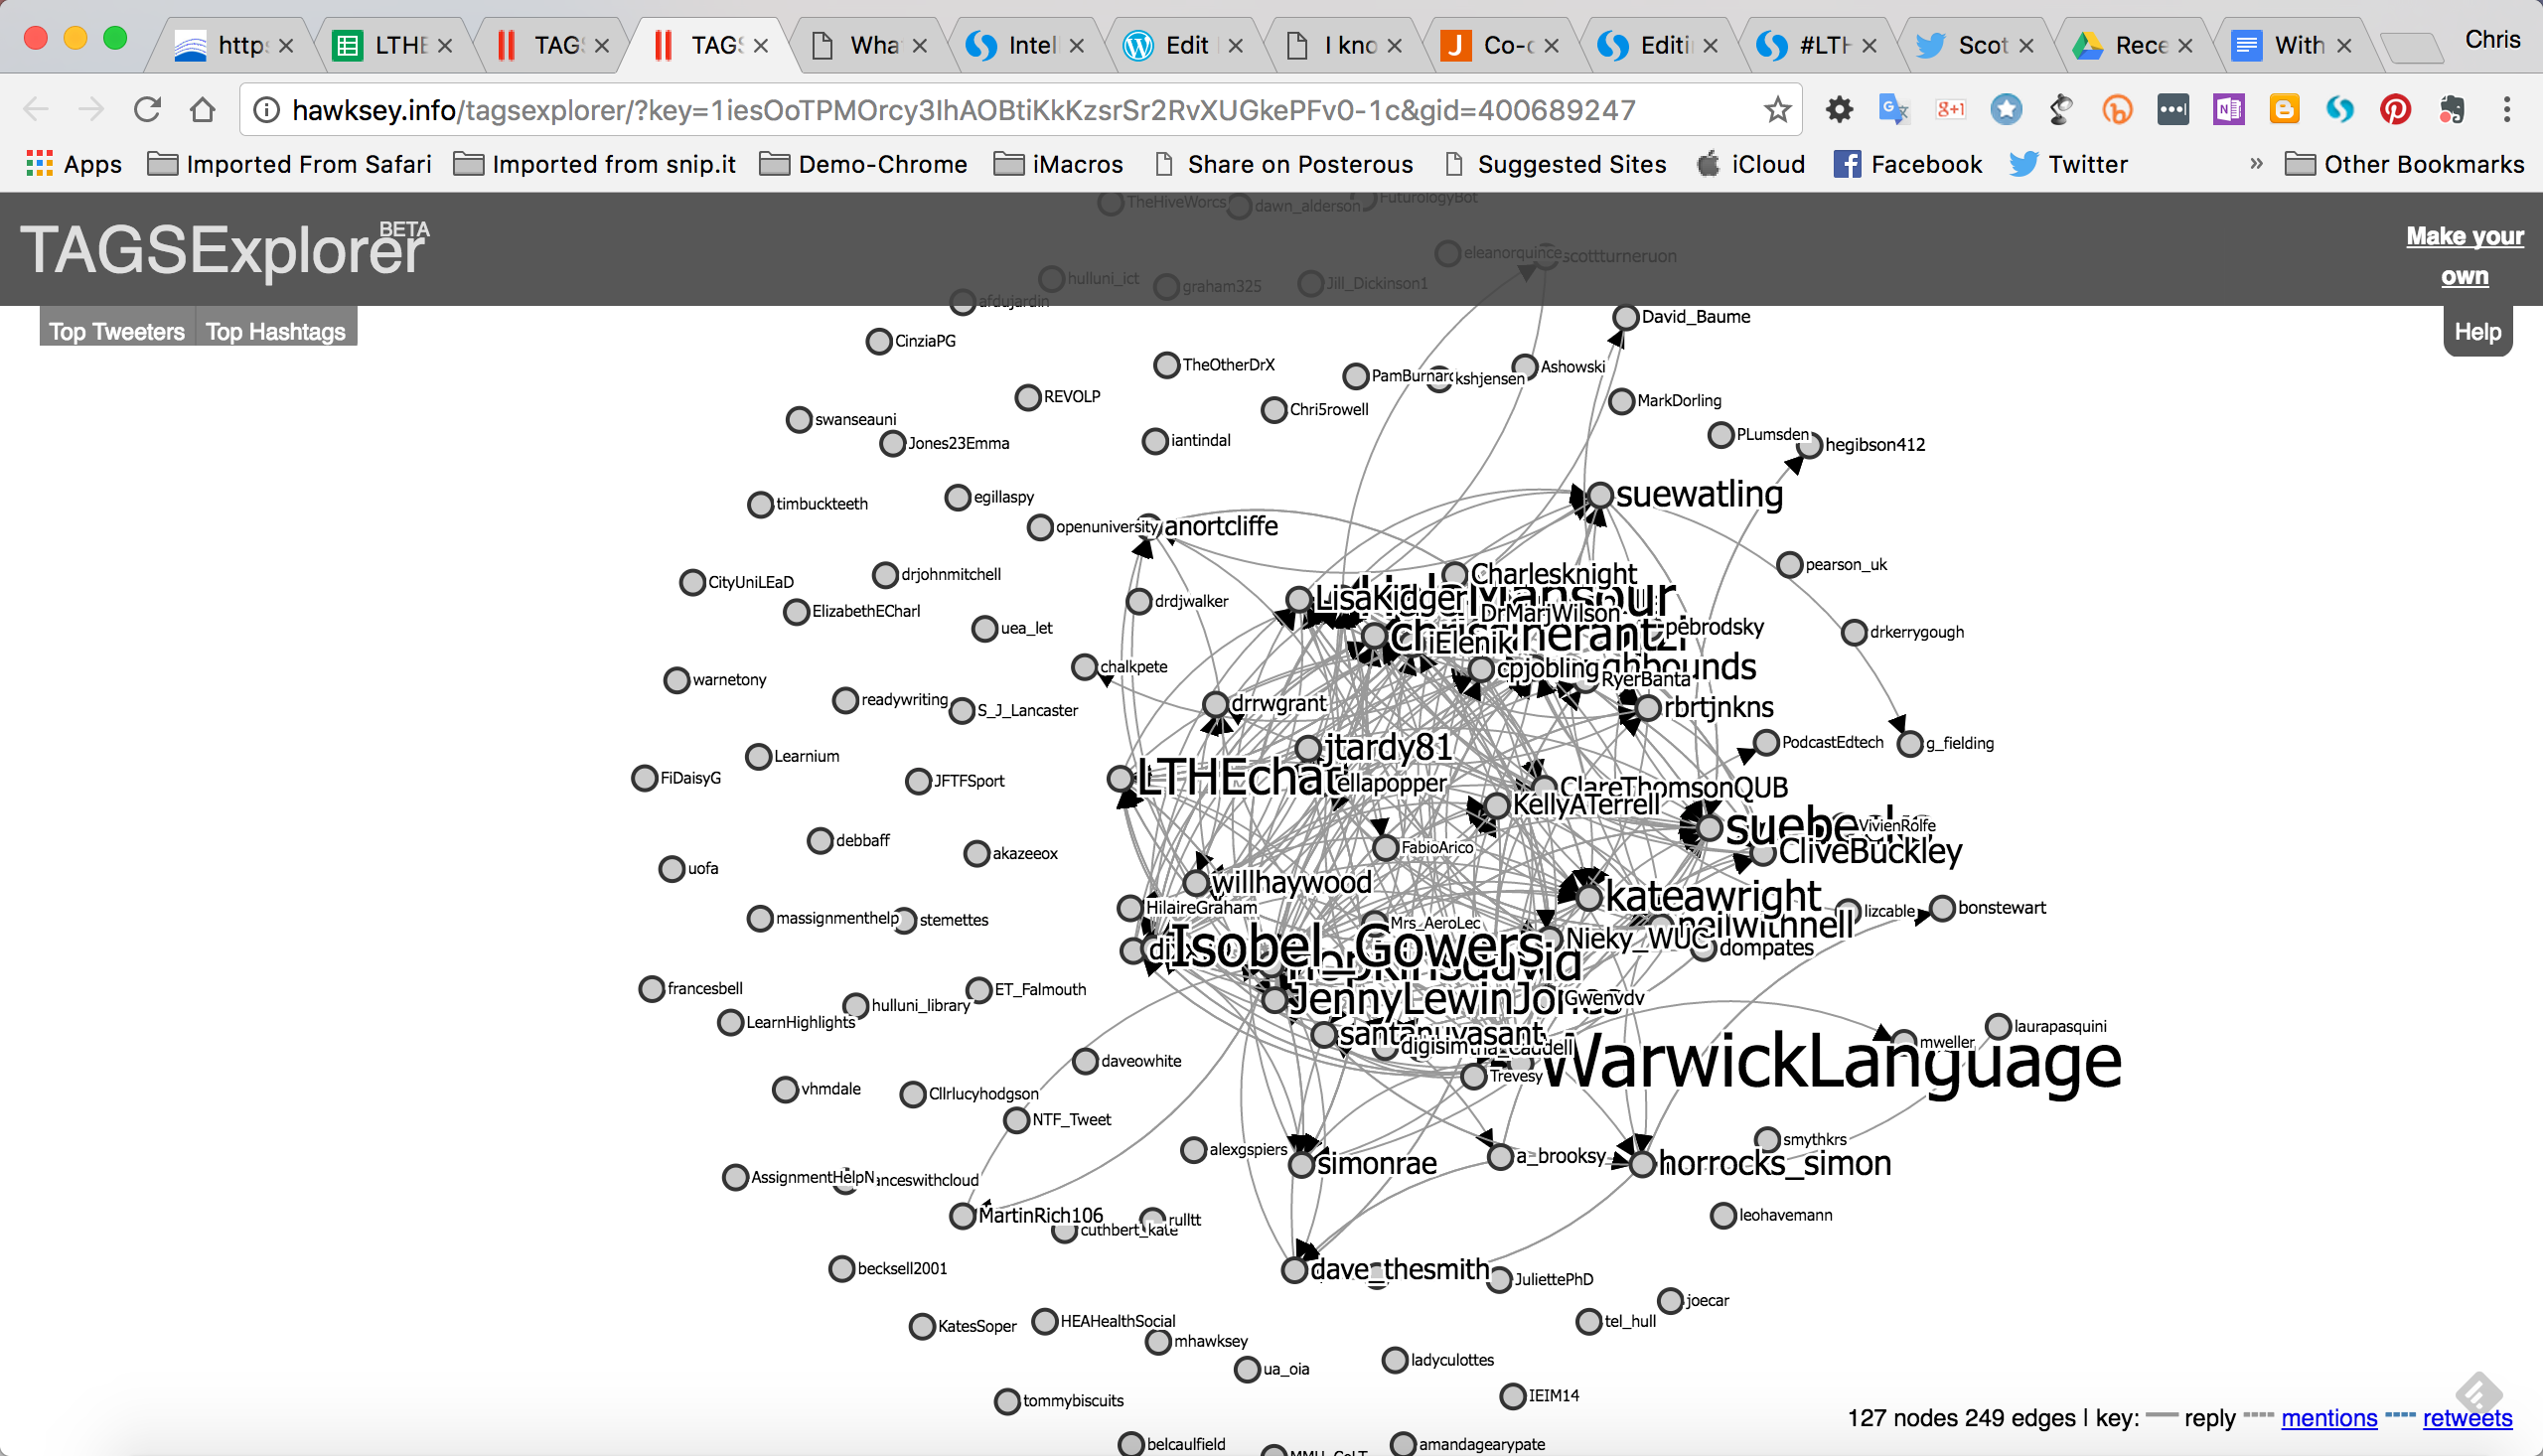
As part of our preparation for our presentation for Social Media in Higher Education in December (#SocMedHE16), the team is looking at various ways to assess the impact of the weekly #LTHEchat. As part of this, I agreed to attempt to record a flavour of the excitement of the event by capturing snapshots of the growth of the network over a twenty-four hour period using Martin Hawksey’s TAGSExplorer which generated this visualisation, and Jing.
I created a storify of the tweets and some of the reaction:
View the story “#LTHEChat 66 - the growth of the network”.
We should definitely reflect on Richard Treves’ comments that appear at the end of the story:
#LTHEchat @cpjobling @S_J_lancaster genuine Q re network graphs: what r they showing other than ’thers lots of traffic’? R they just cool? https://t.co/2VQSaHfupx
— Trevesy (@Trevesy) November 2, 2016