The Fourier Transform (Part 1)
Agenda
- Fourier Transform as the Limit of a Fourier Series
- Doing the Maths
- Special forms of the Fourier Transform
- Properties of the Fourier Transform
- Computing Fourier Transforms in Matlab
Scope and Background Reading
This session continues our coverage of Fourier Analysis with an introduction to the Fourier Transform.
Fourier Series is used when we are dealing with signals that are periodic in time. It is based on harmonics of the fundamental frequency $\omega_0$ of the periodic signal where the period $T = 2\pi/\omega_0$.
The line spectrum occur at integer multiples of the fundamental frequency $k\omega_0$ and is a discrete (or sampled) function of frequency.
As the period $T$ is increased, the distance between harmonics decreases because $\omega_0$ reduces.
In the limit $T\to \infty$, the signal becomes aperiodic and $k\omega_0 \to \omega$ which is a continuous function of frequency.
This is the basis of the Fourier Transform which is very important as the basis for data transmission, signal filtering, and the determination of system frequency reponse.
The material in this presentation and notes is based on Chapter 8 (Starting at Section 8.1) of Steven T. Karris, Signals and Systems: with Matlab Computation and Simulink Modelling, 5th Edition. from the Required Reading List. I also used Chapter 5 of Benoit Boulet, Fundamentals of Signals and Systems from the Recommended Reading List.
Fourier Transform as the Limit of a Fourier Series
We start by considering the pulse train that we used in the last lecture and demonstrate that the discrete line spectra for the Fourier Series becomes a continuous spectrum as the signal becomes aperiodic.
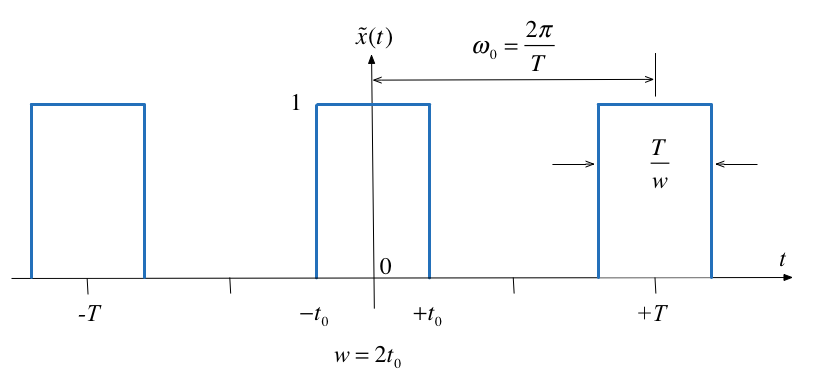
Let $\tilde x(t)$ be the Fourier series of the rectangular pulse train shown below:

Fourier Series
In the previous lecture we used*
$$C_k = \frac{1}{2\pi}\int_{-\pi/w}^{\pi/w} Ae^{-jk(\omega_0 t)}\,d(\omega_0 t) = \frac{A}{2\pi}\int_{-\pi/w}^{\pi/w} e^{-jk(\omega_0 t)}\,d(\omega_0 t) $$
to compute the line spectra.
From the Time Point of View
If we instead take a time point-of-view and let $A = 1$
$$C_k = \frac{1}{T}\int_{-t_0}^{t_0} e^{-jk\omega_0 t}\,dt.$$
Let's complete the analysis on the whiteboard.
The Sinc Function
The function, $\sin(x)/x$ crops up again and again in Fourier analysis. The Fourier coefficients $C_k$ are scaled samples of the real continuous normalized sinc function defined as follows:
$$\operatorname{sinc} u: = \frac{{\sin \pi u}}{{\pi u}},\;u \in \mathbb{R}.$$
The function is equal to 1 at $u=0$* and has zero crossings at $u=\pm n,\; n=1,2,3,\ldots$ as shown below.
Plot the sinc function
Plots:
$$sinc(u) = \frac{\sin \pi u}{\pi u},\; u \in \mathbb{R}$$
x = linspace(-5,5,1000);
plot(x,sin(pi.*x)./(pi.*x))
grid
title('Graph of sinc function')
ylabel('sinc(u)')
xlabel('u')
Duty cycle
- We define the duty cycle $\eta = 2t_0/T$ of the rectangular pulse train as the fraction of the time the signal is "on" (equal to 1) over one period.
- The duty cycle is often given as a percentage.
The spectral coefficients expressed using the normalized sinc function and the duty cycle can be written as
$$C_k = \frac{2t_0}{T}\frac{\sin\left(\frac{\pi k2t_0}{T}\right)}{\frac{\pi k2t_0}{T}}=\frac{2t_0}{T}\operatorname{sinc}\left(\frac{k2t_0}{T}\right)$$
$$C_k = \eta \operatorname{sinc}\left(k\eta\right)$$
Normalize the spectral coefficients
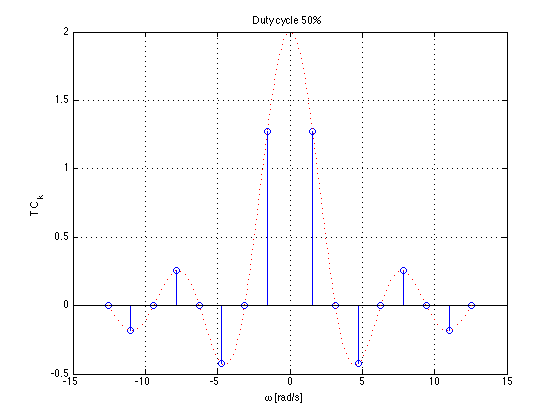
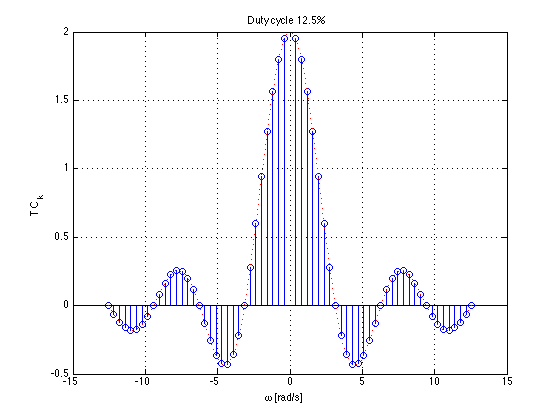
Let us normalize the spectral coefficients of $\tilde x(t)$ by mutiplying them by $T$, and assume $t_0$ is fixed so that the duty cycle $\eta = 2t_0/T$ will decrease as we increase $T$:
$$T C_k = T\eta \operatorname{sinc}\left(k\eta\right)=2t_0\operatorname{sinc}\left(k\frac{2t_0}{T}\right)$$
Then the normalized coefficents $T C_k$ of the rectangular wave a sinc envelope with constant amplitude at the origin equal to $2t_0$, and a zero crossing at fixed frequency $\pi/t_0$ rad/s, both independent of T.
Plots follow (use duty_cycle.m to reproduce).
Durty cycle 50%

Duty cycle 12.5%

Intuition leading to the Fourier Transform
- An aperiodic signal that has been made periodic by "repeating" its graph every $T$ seconds will have a line spectrum that becomes more and more dense as the fundamental period is made longer and longer.
- The line spectrum has the same continuous envelope.
- As $T$ goes to infinity, the line spectrum will become a continuous function of $\omega$.
- The envelope is this function.
Doing the Maths
Fourier series coefficients for the rectangular wave are computed using:
$$C_k = \frac{1}{T}\int_{-t_0}^{t_0} \tilde{x}(t) e^{-jk(\omega_0 t)}\,dt $$
where $\omega_0 = 2\pi/T$ as usual.
Now define a signal $x(t)$ as a signal equal to $\tilde{x}(t)$ over one period and zero elsewhere.

A rectangular pulse
The aperiodic signal, a single rectangular pulse, can be thought of as being periodic with an infinite fundamental period (we will let $T\to +\infty$ later).
Since $\tilde{x}(t)=x(t)$ over $t \in [-T/2,T/2]$, the spectral coefficients $C_k$ of the periodic signal $\tilde{x}(t)$ can be written in terms of the aperiodic signal $x(t)$ as follows:
$$C_k = \frac{1}{T}\int_{-\infty}^{+\infty}x(t)e^{-jk\omega t} dt.$$
Let us define the envelope $X(j\omega)$ of $T C_k$ (we already know this to be the sinc function):
$$X(j\omega):= \int_{-\infty}^{+\infty}x(t)e^{-j\omega t} dt = \int_{-t_0}^{+t_0}e^{-j\omega t} dt = 2t_0\operatorname{sinc}\left(\frac{t_0}{\pi}\omega\right).$$
The coefficients $C_k$ are therefore samples of the continuous envelope $X(j\omega)$:
$$C_k = \frac{1}{T}X(jk\omega_0).$$
Back to the periodic signal
$\tilde{x}(t)$ has the Fourier series representation
$$\tilde{x}(t) = \sum_{k=-\infty}^{\infty}\frac{1}{T}X(jk\omega_0)e^{jk\omega_0 t}.$$
or equivalently, since $\omega_0 = 2\pi/T$:
$$\tilde{x}(t) = \frac{1}{2\pi} \sum_{k=-\infty}^{\infty}X(jk\omega_0)e^{jk\omega_0 t}\omega_0.$$
Now take the limits
At the limit, as $T\to \infty$, in
$$\tilde{x}(t) = \frac{1}{2\pi} \sum_{k=-\infty}^{\infty} X(jk\omega_0)e^{jk\omega_0 t}\omega_0.$$
We get
- $\omega_0 \to d\omega$ – the fundamental frequency becomes infinitesimally small.
- $k\omega_0 \to \omega$ – harmonic frequencies get so close together they become a continuum.
- The summation becomes an integral.
- $\tilde{x}(t) \to x(t)$ – the periodic signal tends to the aperiodic signal.
Define the Inverse Fourier and Fourier Transform
Putting these elements together we have an expression for the aperiodic signal in terms of its Fourier transform:
Inverse Fourier Transform:
$$x(t) = \frac{1}{2\pi} \int_{-\infty}^{\infty} X(j\omega)e^{j\omega t}\,d\omega := \mathcal{F}^{-1} \left\{X(j\omega)\right\}$$
Similarly, given the expression we have already seen for an arbitrary $x(t)$:
Fourier Transform:
$$X(j\omega) = \int_{-\infty}^{\infty}x(t)e^{-j\omega t}\,dt := \mathcal{F}\left\{x(t)\right\}.$$
Fourier Transform Pair
- The two equations on the previous slide are called the Fourier transform pair.
Properties of the Fourier Transform
Again, we will provide any properties that you might need in the examination.
You will find a number of these in the accompanying notes.
Examples
- Amplitude Modulation
- Impulse response
- Energy computation
Example 1: Amplitude Modulation
Compute the result of multiplying a signal $f(t)$ by a carrier waveform $\cos \omega_c t$.
Hint use Euler's identity and the frequency shift property
Example 2: Impulse response
A system has impulse response $f(t) = e^{-t}u_0(t)$. Compute the frequency sprectrum of this system.
Example 3: Energy computation
An aperiodic real signal $f(t)$ has Fourier transform $F(j\omega)$. Compute the energy contained the signal between 5kHz and 10kHz.
Computing Fourier Transforms in Matlab
MATLAB has the built-in fourier and ifourier functions that can be used to compute the Fourier transform and its inverse. We will explore some of thes in the next lab.
For now, here's an example:
Example
Use Matlab to confirm the Fourier transform pair:
$$e^{-\frac{1}{2}t^2}\Leftrightarrow \sqrt{2\pi}e^{-\frac{1}{2}\omega^2}$$
syms t v omega x;
ft = exp(-t^2/2);
Fw = fourier(ft,omega)
Fw =

2^(1/2)*pi^(1/2)*exp(-omega^2/2)
pretty(Fw)
                    /        2 \
                    |   omega  |
sqrt(2) sqrt(pi) exp| - ------ |
                    \      2   /
Check by computing the inverse using ifourier
ft = ifourier(Fw)
ft =

exp(-x^2/2)
End of First Hour
Summary
- Fourier Transform as the Limit of a Fourier Series
- Doing the Maths
- Special forms of the Fourier Transform
- Properties of the Fourier Transform
- Computing Fourier Transforms in Matlab